
Monday, July 1, 2013

Wednesday, March 27, 2013
New version of XCMS Online released
A new version of XCMS Online was released today. The upgraded website now includes an interactive cloud plot to visualize results from untargeted metabolomic experiments, a job sharing center, a parameter manager to organize existing parameter sets, support for Bruker raw data files and more. The detailed list of changes can be found here.
 |
| Cloud Plot |
Friday, March 16, 2012
Review about bioinformatic tools for metabolomics
follow-up to my last posting: Today I was reading the review below and I found it amusing to read this:
"... However, the relatively low sensitivity of NMR, and the spectral overlap that often occurs, limits the number and variety of metabolites than can be simultaneously observed. Hyphenated mass spectrometry (MS) methods, such as GC-MS, LC-MS, and CE-MS, currently provide higher sensitivity, and are the leading analytical platform for metabolite profiling."
Bioinformatics Tools for Mass Spectroscopy-Based Metabolomic Data Processing and Analysis
Sugimoto, Masahiro; Kawakami, Masato; Robert, Martin; Soga, Tomoyoshi; Tomita, Masaru
Current Bioinformatics, Volume 7, Number 1, March 2012 , pp. 96-108(13)
"... However, the relatively low sensitivity of NMR, and the spectral overlap that often occurs, limits the number and variety of metabolites than can be simultaneously observed. Hyphenated mass spectrometry (MS) methods, such as GC-MS, LC-MS, and CE-MS, currently provide higher sensitivity, and are the leading analytical platform for metabolite profiling."
Bioinformatics Tools for Mass Spectroscopy-Based Metabolomic Data Processing and Analysis
Sugimoto, Masahiro; Kawakami, Masato; Robert, Martin; Soga, Tomoyoshi; Tomita, Masaru
Current Bioinformatics, Volume 7, Number 1, March 2012 , pp. 96-108(13)
Wednesday, March 14, 2012
"Slightly" biased review
Metabolomics of sepsis-induced acute lung injury: a new approach for biomarkers
Paige Lacy
Am J Physiol Lung Cell Mol Physiol. 2011 Jan;300(1):L1-3. Epub 2010 Nov 5.
"... In particular, NMR is widely used for “classic” metabolic studies, because this approach has an exceptional capacity to rapidly identify and quantify multiple metabolites in biological fluids. Other approaches involving mass spectrometry are limited in their ability to identify more than a few small molecules in complex mixtures and are unable to quantify metabolites accurately."
For a review, I think this is a more than questionable statement.
Paige Lacy
Am J Physiol Lung Cell Mol Physiol. 2011 Jan;300(1):L1-3. Epub 2010 Nov 5.
"... In particular, NMR is widely used for “classic” metabolic studies, because this approach has an exceptional capacity to rapidly identify and quantify multiple metabolites in biological fluids. Other approaches involving mass spectrometry are limited in their ability to identify more than a few small molecules in complex mixtures and are unable to quantify metabolites accurately."
For a review, I think this is a more than questionable statement.
Thursday, October 20, 2011
Retention time prediction software
Easy and accurate high-performance liquid chromatography retention prediction with different gradients, flow rates, and instruments by back-calculation of gradient and flow rate profiles Paul G. Boswell, Jonathan R. Schellenberg, Peter W. Carr, Jerry D. Cohen, Adrian D. Hegeman
An implementation and source code is available here.
".. This approach provides a simple way to correct for all instrument-related factors affecting retention, allowing dramatically streamlined and improved retention projection across gradients, flow rates, and HPLC instruments."
And here are the limitations:
1) Solvent A must be 0.1% formic acid in water and solvent B must be pure acetonitrile
2) The column temperature must be set to 35 °C
3) The stationary phase must be Waters Acquity BEH C18 (1.7 μm, 130 Å)
4) The retention database only contains 35 compounds.
An implementation and source code is available here.
".. This approach provides a simple way to correct for all instrument-related factors affecting retention, allowing dramatically streamlined and improved retention projection across gradients, flow rates, and HPLC instruments."
And here are the limitations:
1) Solvent A must be 0.1% formic acid in water and solvent B must be pure acetonitrile
2) The column temperature must be set to 35 °C
3) The stationary phase must be Waters Acquity BEH C18 (1.7 μm, 130 Å)
4) The retention database only contains 35 compounds.
Thursday, September 8, 2011
Dancing with the yeast cells
Some guys from New Zeland at the Centre for Microbial Innovation designed what I think is the funniest metabolomics experiment so far. They compared the metabolome of yeast cells growing in defined liquid medium exposed to music and silence. The biomass production was decreased by 14% when the cells were exposed to sonic stimuli, and the metabolite profile was also significantly different compared with silence.
http://www.springerlink.com/content/e6143q34160g633r/
Unfortunately, they didn't specify in their methods what kind of music they used. Was it Britney Spears or Enrique Iglesias? that might clearly explain the lower biomass production... I bet they also activated signaling for apoptosis.
Clearly, a great candidate paper for the Ig Nobel Prize ;-)
http://www.springerlink.com/content/e6143q34160g633r/
Unfortunately, they didn't specify in their methods what kind of music they used. Was it Britney Spears or Enrique Iglesias? that might clearly explain the lower biomass production... I bet they also activated signaling for apoptosis.
Clearly, a great candidate paper for the Ig Nobel Prize ;-)
Monday, August 29, 2011
Global Metabolomics Market to Reach $863.8 Million by 2017, According to a New Report by Global Industry Analysts, Inc
http://www.prweb.com/releases/metabolomics_metabonomics/biomarker_discovery/prweb8519517.htm
Monday, June 20, 2011
Announcing the Metabolomics Forum

The Metabolomics Forum is open to everyone for questions and discussions on the topic of metabolomics. Separate forum categories regarding hardware, software, sample preparation and identification topics have been created.
I'm looking forward to seeing you on the forum!
Tuesday, May 31, 2011
LC/MS raw data conversion just got easier!

Wednesday, April 13, 2011
Q-TOF

Has anybody (a lucky guy!) tested on a regular basis different Q-TOF instruments for metabolomics applications? what's your experience with any of these instruments: SYNAPT G2, maXis, 6540 UHD and TripleTOF 5600?
Friday, March 18, 2011
Interesting metabolomics review in Toxicological Sciences
Metabolomics in toxicology: preclinical and clinical applications.
Robertson DG, Watkins PB, Reily MD.
"... Experience has shown that when data analysis ends with colorful PCA or partial least squares plots, the real impact of a metabolomics study is not realized." :)
Robertson DG, Watkins PB, Reily MD.
"... Experience has shown that when data analysis ends with colorful PCA or partial least squares plots, the real impact of a metabolomics study is not realized." :)
Wednesday, March 2, 2011
Cryptogenic Disease and 'Omics Profiling
An interesting and exciting case report will be published in the March edition of Genetics in Medicine (Worthey et al., Genet Med. 2011 Mar, 13(3):255-262). This Brief Report describes the case of a 6-year old boy in Wisconsin suffering from multiple intestinal fistulas. Despite comprehensive clinical evaluations and a battery of tests, the boy's physicians were unable to arrive at a definitive diagnosis and were baffled at a syndrome that had not been seen before. Clinical management was limited, making it difficult for the boy to eat solid food. After over 100 surgeries the boy only grew sicker and the physicians were at a loss. It was at this point that they carried out whole-exome sequencing. It was discovered that the boy had a mutation in his XIAP gene, a mutation not previously associated with the boy's condition but that had been linked with another pathology which was curable by bone-marrow transplantation. The team performed a bone-marrow transplant (which they would not have considered without the sequencing) and saved the boy's life.
This report, as well as a couple of other recent examples from the literature, raises the question of the role of genomics, proteomics, and metabolomics in initiating treatment regimens for cryptogenic disease. Clearly, this is a striking example of the clinical benefit of sequencing a patient with a poorly understood syndrome. Here, sequencing led to treatment insights that would have been otherwise difficult to arrive at. In the context of this particular case study, it is unclear that proteomic and metabolomic profiling would have offered much clinical benefit. Although metabollite profiling may be useful in diagnosing diseases for which biomarkers have been elucidated, would metabolomics be useful to investigate rare cryptogenic cases such as those described here? At this time, it is difficult to imagine learning much interesting information by doing "metabolite profiling" on a single individual without appropriate controls and statistics. But perhaps this is something that may change with the evolution of our understanding of the human metabolome and the development of much more advanced metabolite databases. For now, metabolomics might be better suited for providing pathobiological insight when it comes to dealing with rare cryptogenic disease.
This report, as well as a couple of other recent examples from the literature, raises the question of the role of genomics, proteomics, and metabolomics in initiating treatment regimens for cryptogenic disease. Clearly, this is a striking example of the clinical benefit of sequencing a patient with a poorly understood syndrome. Here, sequencing led to treatment insights that would have been otherwise difficult to arrive at. In the context of this particular case study, it is unclear that proteomic and metabolomic profiling would have offered much clinical benefit. Although metabollite profiling may be useful in diagnosing diseases for which biomarkers have been elucidated, would metabolomics be useful to investigate rare cryptogenic cases such as those described here? At this time, it is difficult to imagine learning much interesting information by doing "metabolite profiling" on a single individual without appropriate controls and statistics. But perhaps this is something that may change with the evolution of our understanding of the human metabolome and the development of much more advanced metabolite databases. For now, metabolomics might be better suited for providing pathobiological insight when it comes to dealing with rare cryptogenic disease.
Tuesday, February 22, 2011
Tuesday, December 21, 2010
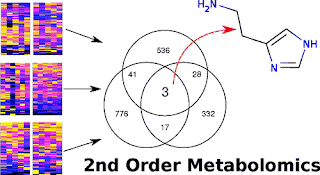
metaXCMS: Second-Order Analysis of Untargeted Metabolomics Data
Abstract: Mass spectrometry-based untargeted metabolomics often results in the observation of hundreds to thousands of features that are differentially regulated between sample classes. A major challenge in interpreting the data is distinguishing metabolites that are causally associated with the phenotype of interest from those that are unrelated but altered in downstream pathways as an effect. To facilitate this distinction, here we describe new software called metaXCMS for performing second-order (“meta”) analysis of untargeted metabolomics data from multiple sample groups representing different models of the same phenotype. While the original version of XCMS was designed for the direct comparison of two sample groups, metaXCMS enables meta-analysis of an unlimited number of sample classes to facilitate prioritization of the data and increase the probability of identifying metabolites causally related to the phenotype of interest. metaXCMS is used to import XCMS results that are subsequently filtered, realigned, and ultimately compared to identify shared metabolites that are up- or down-regulated across all sample groups. We demonstrate the software’s utility by identifying histamine as a metabolite that is commonly altered in three different models of pain. metaXCMS is freely available at http://metlin.scripps.edu/metaxcms/.
The full article is available here.

The full article is available here.
Wednesday, December 1, 2010
Hans Rosling shows the best stats you've ever seen
Beautiful visualizations of statistics by Hans Rosling.
Might be inspiring for visualizations of metabolomics time series data ...
There is also the documentary "The Joy of Stats" on BBC in December.
Might be inspiring for visualizations of metabolomics time series data ...
There is also the documentary "The Joy of Stats" on BBC in December.
Tuesday, November 23, 2010
Combined genome-wide association mapping with metabolomics
Interesting article in PLoS Genetics:
The Complex Genetic Architecture of the Metabolome
Association between more than 200,000 single-nucleotide variants across the genome and levels of 327 metabolites in 96 strains of Arabidopsis thaliana showed that only 23–30% of the variation in cellular metabolite levels was associated with specific sites in the genome.
The Complex Genetic Architecture of the Metabolome
Association between more than 200,000 single-nucleotide variants across the genome and levels of 327 metabolites in 96 strains of Arabidopsis thaliana showed that only 23–30% of the variation in cellular metabolite levels was associated with specific sites in the genome.
Monday, November 15, 2010
The Untargeted Metabolomics Workflow
During the past 2 years, the methodology that I have employed to make metabolite identifications using an untargeted metabolomics workflow has evolved. In 2008, not only were metabolite databases smaller, but they also did not have some of the advanced functionality that is available today. For example, searching for sodium and potassium adducts required manually calculating masses from the observed m/z values. We have come a long way with improvements in both metabolomics software and databases facilitating metabolite identification. Major databases emerging as the key players for untargeted studies are HMDB, Lipid Maps, and METLIN. Each, in my opinion, have their own advantages. I would like to start this blog by surveying which databases metabolomics investigators utilize the most frequently and why. HMDB, for example, provides so-called MetaboCards in which fundamental biological facts are introduced for queried molecules. This information can be particularly useful in filtering putative hits for metabolites that may not be relevant to the sample type being analyzed, such as a hit for a plant metabolite from bacterial cell results. Another new function that has been recently incorporated into METLIN is the ability to search fragment ions from MS/MS data. With this function, it is now possible to do MS/MS on all features of interest in a dataset prior to querying databases to potentially reduce false-negative hits. A few years ago, the workflow of identifying metabolites in a global MS-based study offered little room for creativity. I am certain today, however, that investigators are taking advantage of the various new database functionality in a multitude of innovative ways. I hope that by discussing and exchanging ideas about our untargeted workflows we can learn new ways to facilitate what I still would classify as the rate-limiting step in metabolomics, metabolite identification. So what process do you use to make metabolite identifications? How do you prioritize your feature lists? Do you search all the databases on the web, or do you refine yourself to an in-house library? I look forward to reading about your different points of view!
Friday, November 12, 2010
A short history of XCMS

Colin Smith initially developed XCMS in 2004. In 2008 Steffen Neumann and Ralf Tautenhahn joined the development team and later in 2009 Paul Benton. Today, XCMS contains two methods for LC/MS feature detection and a method for peak detection in single high-res spectra (FTICR, MALDI, DIMS). Two different non-linear retention time correction methods are available, and two methods to group LC/MS features. A separate method is implemented to align single high-res spectra using a moving-window technique. Mass spectra, TICs, EICs and EIC overlays, 3D LC/MS surface plots and boxplots can be generated by XCMS. Methods to read and preprocess MS/MS data are available. XCMS can make use of multicore processors, as well as MPI or SNOW clusters to speed up the data processing. XCMS is now widely used for untargeted metabolomics, metabolic profiling and biomarker discovery.

Summer 2004: Developed methods for kernel density peak grouping and LOESS retention time alignment (Colin)
Fall 2004: Developed matched filter peak picker, EIC generation (Colin)
March 2005: Checked into Bioconductor SVN repository (Colin)
December 2005: mzXML, mzData import added (Colin)
April 2007: centWave peak detection added (Ralf)
November 2007: Reading of MS/MS spectra added (Steffen)
January 2008: single spectra alignment method added (Steffen)
July 2008: Multiprocessor peak picking added via MPI (Ralf)
March 2009: OBI-Warp retention time alignment added (Steffen, Ralf)
April 2009: group nearest alignment method added (Steffen, Ralf)
June 2010: gap filler/stitch method added (Paul)
September 2010: 64 bit support added (Steffen, Ralf)
Friday, October 29, 2010
What is a feature in metabolomics?
After four years working on numerous projects using untargeted metabolomics, called by some colleagues "global metabolite profiling", my vision of this scientific discipline has been evolving largely as a result of the difficulties I've been encountering. Starting with the sample preparation (i.e., extraction of metabolites), through data processing, and ending with the identification of metabolites, each of these steps has caused me its own headaches. Still, I must admit, I have greatly simplified the whole process and now I can conduct much more pragmatic metabolomics studies. From this blog, I would like to begin a series of dialogues aimed at discussing the various methodological aspects of metabolomics. And I want to start with, perhaps, the subject that has suffered the largest transformation in my methodological workflow: data processing. Those who work with TOF instruments coupled to liquid chromatography will be familiar with the massive amount of data obtained with programs like XCMS. Well, in my opinion it all comes down to understanding the term “feature”. A very simple definition of feature is “a molecular entity with a unique m/z and retention time”. However, one feature does not necessarily correspond to a metabolite. The number of features is always much higher than the number of metabolites. How much? How many features do you typically detect in a regular untargeted metabolomics study? How do you filter features to end up identifying metabolites?
 |
| feature detection with XCMS |
These are some of the points I would like to discuss here. I bet you'll read a lot of different opinions on this matter, and I hope you can convey my experience and I can learn a bit more of all your points of view.
Welcome to metaBlogOmics!
Oscar
Subscribe to:
Posts (Atom)